Launching a Flawless Fiesta: Ford Motor Company

Ford Motor Company is one of the largest automakers in the United States, producing millions of automobiles each year at 70 plants worldwide. According to J. D. Power and Associates Initial Quality Survey, Ford has received more top rankings than any other automaker since 2007. It’s no surprise that high quality standards have kept Ford an industry leader since 1903. And Ford knows that quality begins at a vehicle’s launch. When a cosmetic problem with the vehicle’s carpet threatened the impending launch of the 2011 Ford Fiesta, the company’s Body Interior Six Sigma team saw a clear opportunity for quality improvement through proven optimization methods. In their quest to maintain high customer satisfaction and performance, the team used Minitab Statistical Software to help them eliminate the carpet defect and achieve a successful launch.

The Challenge

The launch date for the Fiesta was quickly approaching when Ford determined that the appearance of brush marks on vehicle carpets would be unacceptable to customers. Ford’s Body Interior Six Sigma team, led by Six Sigma Master Black Belt Scott Sterbenz, began by working with the supplier to analyze the process used to manufacture the automotive carpet. They found that the settings of a machine called a needler were the likely cause of the diminished product quality.

 Blue Ford Fiesta on the left and an orange Ford Fiesta on the right.

Ford Motor Company improved the quality of the carpets in the Ford Fiesta with the help of Minitab Statistical Software.

But the manufacturer worried that altering the needler’s settings also would affect the plushness of the carpet. The team needed to find process improvements that would eliminate brush marks while maintaining the plushness, and they also needed to consider other critical qualities, like the carpet’s durability and stain resistance. As they set out to complete the daunting task of improving carpet quality in the Fiesta, the quality improvement experts turned to the Design of Experiment (DOE) tools in Minitab Statistical Software.

How Minitab Helped

In statistics, DOE refers to the creation of a series of experimental runs, or tests, that provide insight into how multiple variables affect an outcome, or response. In a designed experiment, investigators change more than one factor at a time, and then use statistical analysis to determine what factors are important and identify the optimum levels for these factors. It’s an efficient and economical way to improve almost any process.

With time running out, Ford’s improvement team needed to design an experiment that assessed the effects of the six needler settings on the carpet’s brush markings and plushness levels. The experiment had to satisfy a difficult balance: it needed to be rigorous and reliable, but also needed to minimize the cost of materials and disruption to the supplier’s production schedule. Their challenge was to find an experimental design that would gather sufficient data to optimize the needler settings in as few runs as possible.

Experimental design of optimized factor settings and response values

Experimenters used the Minitab Response Optimizer to determine the optimal configurations for eliminating brush marks and maintaining carpet plushness at the same time.

Minitab’s DOE tools can be used to create and analyze many different kinds of experiments, and can help investigators identify the best experimental design for their situation, based on the number of variables being studied and other conditions. Using Minitab’s DOE tools, the Ford team created a fractional factorial design with center points that would give them the information they needed in only 34 runs.

For each of the experimental runs, a team of evaluators compared the new product to the current carpet, and their ratings were averaged and analyzed. The experimenters also performed a Gage R&R study in Minitab to verify that any changes in the assessed quality of the carpet were a direct result of the factors changed in the experiment, and not due to a variation in the opinions of evaluators.

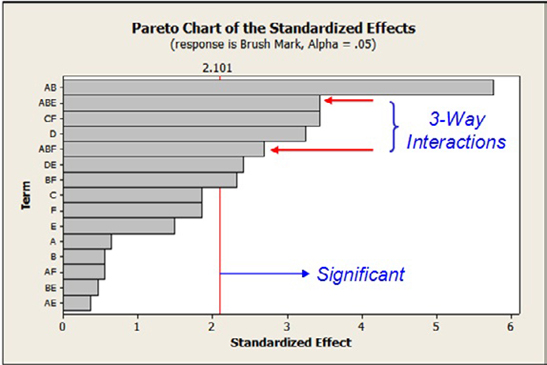
 Pareto Chart of the Standardized Effects

A Pareto chart created in Minitab clearly shows the three-way interactions that had a significant impact on carpet quality.

When data from the 34 runs were analyzed in Minitab, the results for each response revealed complex interactions between the different needler settings. The interactions explained why previous adjustments to individual needler settings had failed to find a way to eliminate brush markings.

The designed experiment not only provided the team with a list of significant variables and interactions, but also with equations to show how the inputs affected the responses. Even better, the results showed that optimization settings for eliminating brush marks did not have an adverse effect on the plushness.

Results

In response to feedback from both the manufacturer and the Fiesta development team, Sterbenz used Minitab’s Response Optimizer tool to fine-tune the optimal settings identified in the initial DOE. Using the results identified in the DOE as a starting point, the Response Optimizer let Sterbenz and his team modify the settings to consider other practical concerns from the manufacturer and the development team.

After the new carpet from the confirmation runs received favorable ratings by the initial evaluators, samples were sent to Ford’s Research and Engineering Center for final assessment. The samples passed all tests for durability, stain resistance, and color and sheen, and the experiment was deemed a major success by all.

The entire project took 12 days, from the time the problem was defined to the point where the solution was in place and the process was under control. Besides a complete elimination of brush marking and an unexpected improvement in the softness of the carpet in the Fiesta, the experimenters achieved a better understanding of the entire manufacturing process.

Minitab helped Ford discover and implement a solution to find the optimum needler settings to eliminate brush marks and simultaneously maintain the plushness of the carpet. The 2011 Ford Fiesta enjoyed a highly successful launch just a few months later, and marked another milestone in Ford’s commitment to excellence and quality improvement.

Access Minitab Case Study

Provide some additional information to view the case study.

 Ford Motor Company Logo


Organization

Ford Motor Company


Overview

  • Founded in 1903
  • Headquartered in Dearborn, Mich. with 70 plants worldwide
  • More than 164,000 employees


Challenge

Identify and fix the manufacturing process of carpets to eliminate brush marks


Products Used

Minitab® Statistical Software


Results

  • A complete elimination of brush markings
  • An unexpected improvement in the softness of the carpet
  • A successful, high-quality launch of the Ford Fiesta